Introduction
Ever wondered about bear trap in trading? Well, a bear trap is a shift in the market that goes against the prevailing downward trend. It can lead traders to close their short positions to minimise losses. Let’s explore more about bear trap, how to recognise them, and ways to get through them.
What is Bear Trap?
A bear trap happens when it looks like the market is going down, so people start selling their investments to avoid losing money. But instead of going down more, the market unexpectedly goes up again. This catches the people who sold their investments off guard because they thought it would keep dropping.

How does a Bear Trap work?
A bear trap is not limited to specific investments like stocks, indices, commodities, or currencies—it can happen in any financial market.
Here’s what typically happens: After a significant upward movement in the price of an asset, it seems to hit a barrier and begins to drop. This makes traders who bet on the price falling, known as bearish traders, think it’s the start of a bigger decline. They then make short positions, hoping to make money as the price drops.
However, if the drop turns out to be temporary, the price starts rising again. The bearish traders are stuck and often rush to reverse their bets by covering their short positions.
Read also: Cheat Sheet Candlestick Patterns
Identify the Bear Trap: A Technical Analysis
It is important to keep a straight mind while trading. It is essential to be resilient and have risk management ready for yourself. These are a few steps to identify the Bear Trap and limit the possibility of losing money.
- Begin by choosing the right timeframe; generally, the four-hour timeframe works well for accuracy.
- Identify support and resistance levels for the chosen instrument.
- Add a stochastic oscillator (like RSI, Stoch, or MACD) to the chart to spot bullish divergence during the key support level breakdown. A divergence suggests the potential for a bear trap, where the price may briefly drop before recovering.
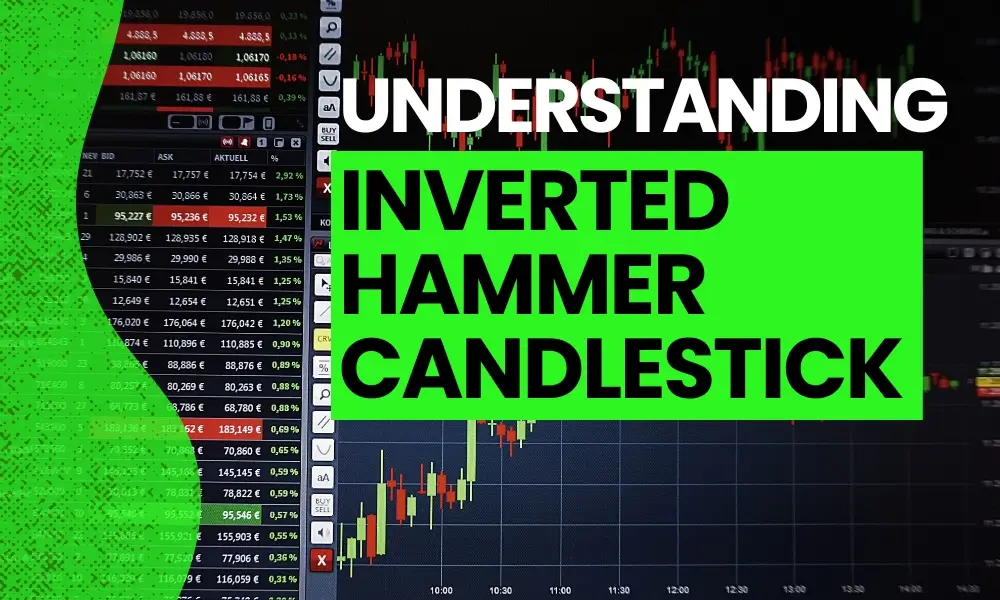
- Analyse candlestick patterns for long entry points within a wide price range. Look for trend reversal patterns like morning star, hammer, inverted hammer, piercing, and bullish engulfing, often seen in bear trap. Small time frames like 30 minutes or hourly can also reveal entry points. To understand such patterns and charts, go for TradeEU.
- Once the entry point is determined, open a position and set a stop loss below the support level. Occasionally, it may be set below the opening of the previous bar.
- Close the position when prices rise to the nearest resistance or in increments, considering pre-identified intense resistance levels where buying pressure is significant.
Example of a Bear Trap
In May 2021, a real-life bear trap unfolded in the crypto market. Bitcoin’s price plummeted from an all-time high of nearly $65,000 to around $30,000. Fearing further decline, many investors sold their Bitcoin.
However, within a few weeks, Bitcoin’s price surged back to nearly $40,000, catching those who sold off guard and causing them to miss out on potential profits.
This case illustrates how fear-driven decisions during market uncertainty can lead to missed opportunities, showcasing the dynamics of a classic bear trap in the crypto space.
How to avoid a Bear Trap?
You can avoid a bear trap by following these steps:
- Avoid short positions during periods of low trading volume for the given security, as this can elevate the risk of falling into a bear trap.
- Consider employing alternative trading strategies, like purchasing put options, to mitigate potential losses. Short selling theoretically has no cap on losses.
- Advanced traders might leverage Fibonacci levels, a technical analysis tool to identify support and resistance levels. Botbro offers primary technical analysis tools for trading.
- Consider refraining from entering a short position altogether.
What is an Evening Star?
The evening star is a candlestick pattern employed by technical analysts to identify potential trend reversals. This bearish pattern unfolds over three candles:
- A large white candlestick
- A small-bodied candle
- A red candle.

Typically occurring at the peak of an uptrend, the evening star signals the potential conclusion of the upward trend. Its counterpart, the morning star pattern, is considered a bullish indicator.
Bull Trap vs Bear Trap

Here are the prominent differences between bull traps and bear traps:
Bear Trap and Bull Trap
- A bear trap happens when investors sell to avoid expected price drops, only for the market to unexpectedly bounce back, causing them to miss potential gains.
- Conversely, a bull trap occurs when investors anticipate an upswing, buy-in, and face losses as prices fall.
Investor Behavior in Traps
- In a bear trap, overly pessimistic investors sell too early, missing profit opportunities.
- In a bull trap, overly optimistic investors buy in too early, resulting in losses during a market dip.
Market Trends and Trap Occurrence
- Bear traps are common in bearish markets with a downward trend.
- Bull traps are more frequent in bullish markets with an upward trend.
Causes of Market Movement in Traps
- In a bear trap, unexpected positive news or a sudden demand surge can trigger a market rebound.
- In a bull trap, negative news or a sudden decrease in demand may lead to a market drop.
Psychological Drivers of Traps
- Bear traps often arise from fear and panic-driven investor decisions.
- Bull traps are typically fueled by greed and optimism among investors.
Bear Trap Vs Legitimate Bearish Move

There is a thin line between a bear trap and a legitimate bearish move; here are these:
Bear Traps
- Brief declines within an overall upward price trend.
- This is frequently followed by a significant upward move as trapped bears buy shares to close short positions.
Legitimate Bear Moves
- Reversals from a preceding uptrend.
- Typically involves a substantial retracement of uptrend gains and break critical support and Fibonacci levels.
- Legitimate bear moves may conclude with a bullish reversal or a shift to sideways price action.
Conclusion
In trading, a bear trap signifies an abrupt shift in the downward movement of security prices, leading to substantial losses for short-sellers. Even during an upward trend, stocks may experience a sudden drop, creating a perception of bearish signals. Look for Sensibull broker safer trading and avoiding such traps, you can head out to Sensibull educational resources for quality knowledge.
As traders position themselves in anticipation of a price dip, the stock prices unexpectedly surge upward. Traders must grasp the dynamics of these traps, exercising caution and refraining from short-selling during such situations.
FAQs
What does the bear trap mean in trading?
A bear trap is when traders intentionally sell substantial volumes of a specific asset to drive its price down. This action creates a deceptive appearance of a market decline, convincing other traders that the asset is losing value and prompting them to sell their positions.
Is a bear trap considered positive or negative?
Any market situation can be advantageous if the trader employs the right strategies. The bear trap is no different. By utilising the strategies outlined above, traders have the potential to generate profits.
What are the indicators of a bear trap?
Start by choosing a timeframe— the larger the signal, the more reliable it is. Identify resistance and support levels while closely monitoring the price. Follow this with a thorough technical analysis. Short sellers must exercise caution in their investment choices and avoid making hasty moves.
What is a bull trap?
A bull trap occurs when traders take a long position as the price of a currency pair is increasing, only to experience a reversal, causing the price to move lower.